Annual e-Government Perception Survey 2006
Background
The e-Government Customer Perception Survey is conducted annually by the Ministry of Finance and Infocomm Development Authority of Singapore to assess the general public's level of receptivity towards e-Government initiatives.
The objectives of the survey are to:
- Determine the proportion of population who have transacted with the Government electronically and their satisfaction with Government e-services; and
- Determine the proportion of population who have transacted with the Government using non-electronic means (e.g. counter, poster, fax) and their reasons for not using electronic means.
The fourth e-Government Customer Perception Survey was conducted in March 2006 to assess the general public's receptivity towards e-Government initiatives in 2005.
Research Methodology
1,200 respondents, representative of the total demographic population above the age of 15, were surveyed from 13 to 25 Mar 2006. Data collection was done through telephone interviews, administered in English, Chinese and Malay.
Survey Results
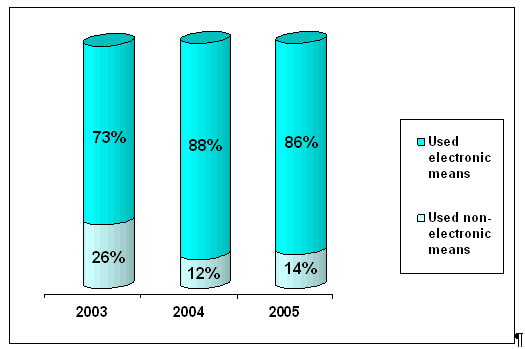
(i) In 2005, 9 out of 10 who transacted with the Government did so electronically at least once in the past 12 months
Of those who had a need to transact and had transacted with Government in 2005, 9 out of 10 did so electronically (i.e. via internet, kiosk, IVRS, e-mail, SMS, etc) at least once in the past 12 months. This was similar to the 2004 survey results. The remaining 1 out of 10 used non-electronic means such as counter, fax or post to transact with the Government.
Figure 1
(ii) In 2005, 85% of users were satisfied with the overall quality of the electronic services
In 2005, 85% gave 4 and above out of a 6-point scale on their satisfaction level with the overall quality of electronic services. The result for the overall quality of e-services was 80% in 2003 and 81% in 2004.
Figure 2
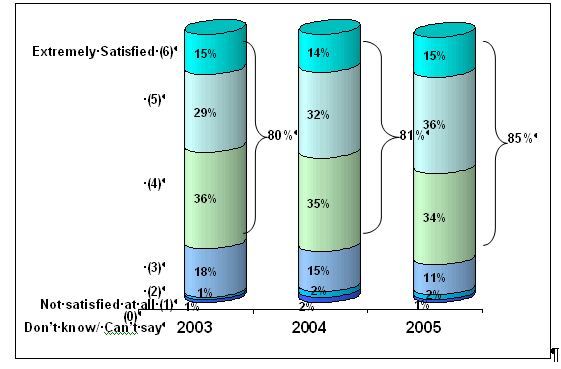
If “don’t know/ can’t say” is excluded, percent satisfied (i.e. 4-6) is 80% for 2003, 81% for 2004, 86% for 2005
(iii) Profile of those who transacted electronically with the Government
The typical profile of those who transacted electronically with the Government was:
- 20 to 39 years; and
- held white-collar jobs.
(iv) Reasons why people used electronic means to transact with the Government
Among those who transacted electronically with the Government, the key reasons for doing so were:
- saved time
- easy-to-use
(v) Profile of those who used non-electronic means to transact with the Government
The typical profile of those who used non-electronic means to transact with the Government was:
- Aged 50 and above; and
- Likely to hold blue-collar jobs, are housewives, retirees or unemployed.
(vi) Reasons why people did not use electronic means to transact with the Government
Among those who did not transact electronically with the Government, the key reasons given were:
- No need to use Government e-services
- Not familiar (with e-services)
- Do not know how to access internet/ not familiar with internet
- Preferred personal contact
- Did not have computer access
(vii) The 5 most cited Government e-services in 2005
Of the Government e-services the respondents had read or heard of, the 5 most cited e-services in 2005 were:
- File income tax returns (IRAS)
- Request CPF statements (CPFB)
- Apply for SingPass (CPFB)
- Pay parking fines (URA & HDB)
- Top up or encash Economic Restructuring Shares (ERS) (CPFB)
.webp)