About Singapore Digital
Singapore Digital (SG:Digital) is leading our digital transformation and is a nation-wide movement to unify Singapore’s digitalisation efforts. Whether it is help for different industries to start their digitalisation journeys, or creating new ecosystems, opportunities and capabilities for the future, SG:Digital is set to take us ahead as a leading digital global node.
![]()
The SG:Digital logo is a combination of the Singapore Mark and IMDA’s brand elements. This bold placement announces our passion and vision to drive Singapore into a digital future as one nation.
SG Digital Office
![]()
The SG Digital Office (“SDO”) will drive the Government’s initiatives to accelerate digital adoption in our community, as we embark on a phased recovery post COVID-19.
SDO will mobilise a whole-of-nation movement to accelerate Singapore’s digitalisation by building on and ramping up existing efforts to equip every individual and business with digital tools and skills to participate meaningfully in the new social and economic environment post COVID-19. This movement to drive digitalisation in Singapore will start with two groups: our seniors and our stallholders.
About SG Digital Office
Learn more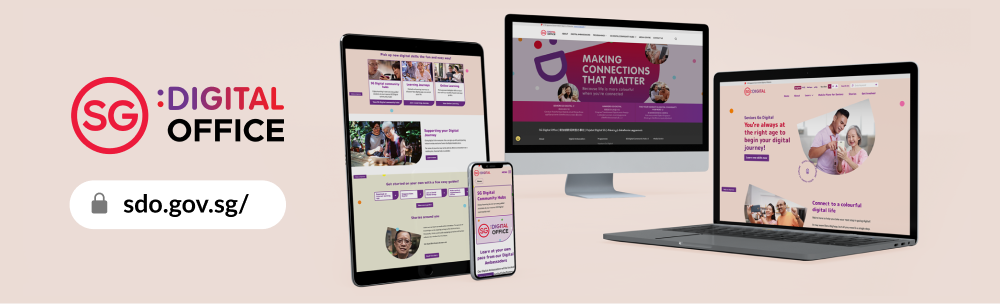
SG Digital Office Website
Learn more
More Reasons to Smile
Digitalisation offers endless possibilities to transform businesses, groom talent, and enrich the way we live - possibilities that are now yours for the taking, with Singapore Digital (SG:Digital).
Singapore Digital (SG:Digital) is leading our digital transformation and is a nation-wide movement to unify Singapore’s digitalisation efforts. Whether it’s help for different industries to jumpstart their digitalisation journeys, or creating new ecosystems, opportunities and capabilities for the future, SG:Digital is set to take us ahead as a leading global node in Asia for this digital economy. Four frontier technology have identified for development in Singapore, namely artificial intelligence, cybersecurity, immersive media, and internet of things.
Find out more about the strategy driving this movement, with the Digital Economy Framework for Action.
SG:Digital for Companies
Transform Businesses:
Growth, Enabled by Digital
SG:Digital for Talent
Groom Talent: Get Ahead
With the Right Digital Skills
SG:Digital for Communities
Enrich Lifestyles:
Endless Possibilities for All
More on SG:Digital
Digital Economy for Action
Learn more
Service and Tech Roadmap
Learn more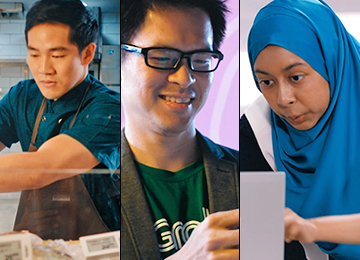
Watch our SG:Digital Videos
Learn more

.webp)